টিউটোরিয়াল / গাইডলাইন অ্যান্ড্রয়েড অ্যাপ ডাউনলোড
Google Play
GET IT ON Google Play
StudyClub - স্মার্ট স্টাডি প্ল্যাটফর্ম
মেনু
Self Tracker
Messenger
Question Bank
Study User Report
Session Report
To do list Report
Study Leaderboard
Screen Time Leaderboard
Public Dashboard
Quiz Creator
Quiz Leaderboard
হোম
Profile
About
Tutorials
থিম নির্বাচন

আপনার পছন্দের থিম বেছে নিন।

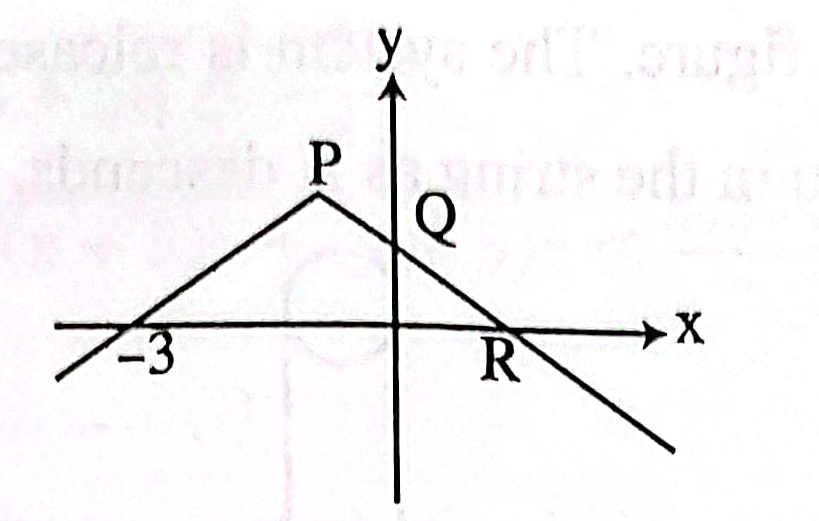
Following figure shows the graph of y=f(x),  x€ℝ. The graph consists of two line segments that meet at the point P. The graph cut the y-axis at the point Q and the x-axis at the points (-3,0) and R. Find the coordinates of the point Q and R.

A. Q(1,0), R(1,1)
B. Q(0,1), R(1,0)
C. Q(1,1), R(1,0)
D. Q(1,1), R(1,1)
সঠিক উত্তরঃ B. Q(0,1), R(1,0)
Explanation: